Assessing the circulation
Assessing the circulation is perhaps the most fundamental skill in the intensive care unit. However, it is also the most challenging and should not be taken for granted. Each sign or tool that can be used can lead us astray in one direction or the other (being falsely reassuring or concerning). Following is simply my take of what I consider the most dependable and useful (in descending order, most useful first) ways to assess the circulation of a patient.
#1. Mental status
When we assess the circulation, what we really want to know is whether it is delivering sufficient substrate to the vital organs to sustain life. If a patient is awake and interactive, or even better taking PO, then substrate delivery is likely sufficient. However, most of our patients are intubated and sedated and therefore this tool is less useful. Always remember to check a glucose if a patient is unresponsive when they shouldn’t be.
#2. Arterial waveforms
In instrumented ICU patients, the arterial line gives us several pieces of reliable data. (1) The pulse pressure generally corresponds with the stroke volume. A pulse pressure <10 mmHg is generally concerning. (2) The mean blood pressure generally corresponds with how full the systemic circulation is combined with the SVR. (3) In patients with a central (e.g. aortic) and peripheral arterial line, there is additional information. The MABP is usually identical between catheters; if the distal MABP is lower than central, it indicates a significant LCOS and elevated SVR. Further, the SBP is normally higher is the peripheral arterial line due to the standing wave. When this is not the case, it also indicates an elevated SVR and low stroke volume state and almost always follows the pattern above as the circulation improves. (4) The duration of the arterial impulse (i.e. the duration of the impulse) is also an important indicator of stroke volume. Patients with a high SVR and a low stroke volume may have a normal or even high SBP but an arterial impulse that lasts into only early systole. (5) The difference between the arterial and venous pressures is also an important marker of the health of the circulation. As the heart fails, not only does the pulse pressure narrow but MABP becomes closer to the CVP, decreasing driving pressure for blood flow. Limitations include arterial vasospasm, leveling of the transducer, problems with waveform dampening, all of which need to be considered.
#3. Pulse oximetry plethysmograph
The pulse oximeter plethysmophragh (i.e. pulse oximetry tracing) is a readout of hemoglobin absorbance in the skin underneath the pulse oximeter over time; the width of the line is a sign of how much extra hemoglobin (blood) is pumped into the finger with each heartbeat. This tool is also useful to monitor a threatened limb, e.g. following a cardiac cath.

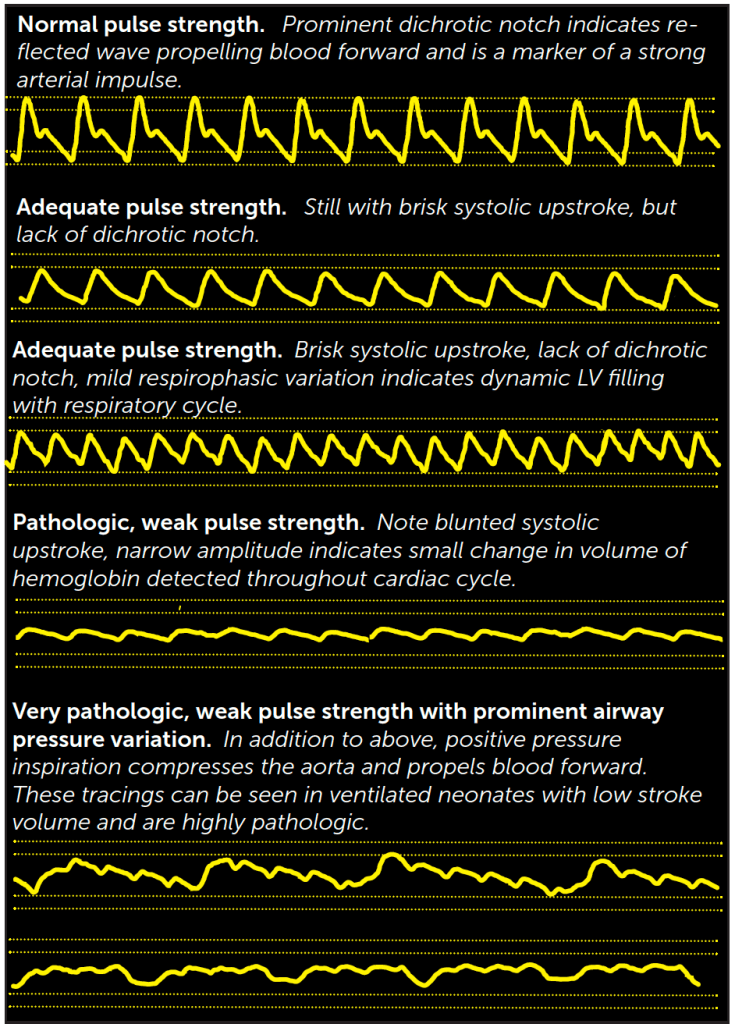
The PPG (and arterial waveform, and pulse strength) can all be falsely reassuring in patients with diastolic runoff lesions (e.g. AR, BTS, PDA stent) that cause the systemic circulation to ‘empty’ during diastole, such that the measured systolic change in hemoglobin (and pulse strength) may be high when tissue oxygen delivery is poor.
#4. Skin color
The skin must be examined with the lights on in the room and the child mostly exposed. Often a grayish hue can be difficult to recognize in a dark room in the middle of the night, so remember to examine the patient in this way when there is concern. A grayish hue can be difficult for new providers to recognize. Gray skin (and its cousin, delayed capillary refill) indicates that blood flow is being diverted to vital organs rather than the skin and is a highly reliable sign that always merits concern.
#5. Pulse strength
I place pulse strength #5 only because of my great respect for the difficulty of a performing an accurate physical examination under pressure. In critical situations in which there are several congruent and concerning pieces of data (e.g. pulse pressure <10 mmHg on arterial catheter, absent pulse oximeter plethysmograph, gray color), the pulse strength is merely confirmatory. However, the fullness and strength of the arterial pulse are always useful data elements particularly in the hands of experienced providers.
#6. Dead space ventilation
The dead space ventilation fraction can be calculated as (PaCO2-end tidal CO2)/PaCO2. In the cardiac ICU, a dead space fraction >10% often represents decreased pulmonary blood flow. In some cases (e.g. unrepaired tetralogy of Fallot or patient with BTS), this may represent an isolated decrease in PBF. In many patients, though, PBF is closely tied with systemic blood flow, such that concern should be raised for decreased cardiac output. EtCO2<15 mmHg should raise immediate concern for ETT malposition or for cardiac arrest. Another way to assess dead space ventilation is the minute ventilation required to establish a ‘normal’ CO2. MVe>1 LPM is typical of patients in a low cardiac output state.
#7. CO2 production
When oxygen delivery is significantly impaired, O2 consumption and CO2 production decrease below what is normal for health. In neonates, a VCO2<5 mL/kg/min is generally concerning for LCOS, and <3 mL/kg/min even moreso. However, this tool has different implications in patients with airway obstruction.
Preload
Definition. In an isolated muscle, preload refers to the force required to stretch a muscle to a desired precontractile length. In an intact heart, preload can be purely defined as the end-diastolic fiber length of a myocyte. Unfortunately, this cannot be directly measured (yet), so preload is discussed as a concept rather than a number.
Importance. Increasing preload leads to an increasing number of overlapping/contractile cross-bridges between the contractile proteins (actin and myosin). As Frank-Starling noted, the heart pumps the volume that it receives; in the healthy heart, increased preload therefore leads to increased stroke volume and cardiac output. Further, increased preload leads to increased contractile force (i.e. contractility) and shortening fraction. This further augments cardiac output in a healthy heart.

How I clinically assess preload
Because preload cannot be directly measured, here are commonly used surrogates that frame how to assess it.
Atrial pressure or central venous pressure represents the driving pressure that fills the ventricle (unless there is AVV stenosis). Another important feature to consider is called preload-recruitable stroke work. In health, increasing EDP by 1-2 mmHg increases end diastolic volume significantly. This is why giving a fluid bolus to a healthy patient may increase RA pressure by 0-1 mmHg but may increase end diastolic volume (-> stroke volume ->cardiac output -> arterial blood pressure) by significantly more. The relationship between these two variables is the end-diastolic pressure-volume relationship (EDPVR), plotted on a pressure-volume curve. In patients who are ill, it is important to determine whether increasing atrial pressure increases stroke volume (or stroke work, which is stroke volume x pressure). If administration of a small fluid bolus increases atrial pressure but does not significantly change systolic pressure or pulse pressure, then we presume that the compliance curve is steep (i.e. pathologic) and that further increasing EDP will not increase (i.e. recruit additional) stroke volume.
Patients with compromized preload should be assessed for factors that may diminish ventricular compliance.
Impact of vascular tone on preload
Because preload is affected by atrial pressure, vascular tone significantly affects preload.
For a given intravascular volume, vasodilation increases the reservior volume, reduces atrial pressure and decreases ventricular filling. Patients with restrictive physiology may therefore poorly tolerate vasodilation (e.g. milrinone or sodium nitroprusside).
Vasoconstriction increases atrial pressure and increases ventricular filling.
The cardiac cycle summarized in a curve

A single PV loop plots the relationship between ventricular pressure and volume throughout the cardiac cycle.
Systole (red line) begins (3) with an abrupt increase in ventricular pressure until it exceeds aortic diastolic pressure, opening the aortic valve (4). As ventricular volume decreases, pressure peaks and then decreases until the aortic valve closes as myocyte relaxation abruptly decreases pressure (1). The end-systolic pressure-volume relationship (ESPVR, black dotted line) describes how afterload affects stroke volume, and its slope is a measure of contractility (which can be affected by inotrope infusion).
Diastole (blue line) begins at the end of systole (1) with myocyte relaxation and decrease in ventricular pressure. When atrial pressure exceeds ventricular pressure, the AV opens (2) causing an increase in ventricular volume until end-diastole is reached. The end-diastolic pressure volume relationship (EDPVR, dotted blue line) must be plotted over many heart beats and physiologic conditions; the slope and shape of this theoretical line is often the most important determinant of outcome (steep curves require high pressures to fill, resulting in atrial hypertension). Preload can be defined as end-diastolic volume, the X intercept of where the yellow line crosses EDPVR curve.