Pressure-volume loop basics
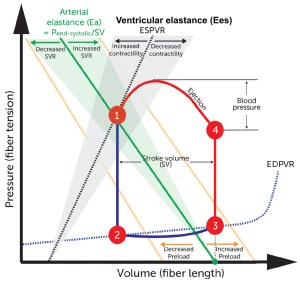
To better understand the nuances of inotropy and preload and afterload, it is important to understand this graphic called a pressure volume loop. The graphic in the middle represents one heartbeat.
Start at point 3: This point represents end diastole. The X intercept of that point represents end diastolic volume.
Move from point 3 to 4: As myocytes begin to contract, pressure in the ventricle increases but volume stays the same – this represents isovolemic contraction. Then assuming no aortic stenosis or LVOTO, the AV opens when ventricular pressure exceeds diastolic blood pressure in the aortic root (point 4).
Cardiac ejection and arterial elastance (Ea)
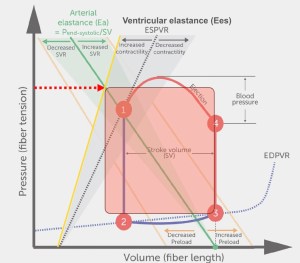
Between points 4 and 1 is where things get complicated as the heart ejects blood from the ventricle and into the arterial system. The heart pumps blood with force into an elastic system – remember the aorta is already full when the heart starts to eject – so the blood ejected is either immediately propelled forward (i.e. cardiac output) or stored locally as the aorta dilates (as potential energy). So the amount of blood that the heart ejects is at least somewhat dependent on how much resistive force there is in the arterial system – force that opposes ventricular ejection. This resistance should really be called impedance, which is a Fourier transformed representation of the interactions of arterial elastance and flow throughout the cardiac cycle. Arterial elastance (Ea, green line) is not a measure of a specific vascular property per se but combines both mean and pulsatile loading and heart rate influences, providing a lumped parameter reflecting the net impact of this load on the heart. (To better understand why we can do this, read this paper). Drugs that are vasodilators decrease arterial elastance (or said another way – increase the compliance – they are inverse of one another) of the arterial circulation, shown here by the shaded green to the left).

If we decrease arterial elastance (yellow line shows the leftward shift in Ea) and hold everything else the same – including preload and contractility (symbolized by the black line) – the stroke volume increases (and therefore so does cardiac output) at a lower ventricular and arterial blood pressure.
Contractility and inotropic state
As with Ea, a pure measure of ventricular contractility is also challenging to capture optimally, because it should be independent of preload, afterload, heart rate. The relationship between end-systolic pressure and volume from cardiac contractions across the spectrum of loading conditions yields the end-systolic pressure volume relationship (ESPVR, dotted black line). The slope of the ESPVR line is known as end-systolic ventricular elastance (Ees). (You might be asking – why are we talking about elastance of the ventricle? Isn’t elastance about how a vessel responds to pulsatile ejection? If so, I did too. But elastance is really just a representation of the relationship between pressure and volume of any chamber, and can apply to an artery or a ventricle at any point in the cardiac cycle.)
If we increase contractility (yellow line has a higher slope than dotted black line and shows the increase in Ees) and hold everything else the same – including preload and arterial elastance – the stroke volume increases and at a higher systolic pressure.
The importance of preload

For a deeper dive, read this paper.